
Are you a small business owner, a marketing manager, or a freelancer looking for a simple, no-fuss way to measure the success of your digital campaigns? We all know that tracking a campaign’s performance can be complex, involving multiple spreadsheets and a lot of manual calculations.
But what if you could have a simple, elegant tool right on your website that does all the heavy lifting for you?
Today, we’re excited to share a free, embeddable campaign analyst tool that allows you to quickly track key metrics like Cost Per Acquisition (CPA) and Return on Investment (ROI) in real time. Simply paste the code into your site, and you’re ready to go!
Table of Contents
How to Use the Tool
Using this tool is designed to be incredibly simple and intuitive. All you need is the basic data from your marketing efforts.
- Enter Your Data: Input the campaign name, total cost, number of conversions, and total revenue into the form fields.
- Click “Add Campaign”: The tool instantly calculates your CPA and ROI and adds the campaign to the data table and the dashboard.
- Analyze Your Results: The summary dashboard and the interactive bar chart provide a clear, at-a-glance view of your campaign’s performance. You can add as many campaigns as you like to compare and contrast their effectiveness.
Campaign Performance Dashboard
Enter your campaign data below to automatically calculate key metrics and visualize performance. Track your spend, conversions, and ROI in one place.
Add New Campaign Data
Summary Dashboard
Campaign Data Table
| Campaign | Cost | Conversions | Revenue | CPA | ROI (%) |
|---|
Campaign Performance Chart
This chart visualizes the Cost Per Acquisition (CPA) for each of your campaigns, helping you quickly identify which ones are most efficient.
Formulas
The JavaScript in the Canvas calculates these metrics using standard marketing formulas:
- Average CPA (Cost Per Acquisition): This is calculated by dividing the total cost of all campaigns by the total number of conversions across all campaigns.

The code implements this with const avgCpa = totalConversions > 0 ? (totalSpend / totalConversions) : 0; which handles the case where there are no conversions.
- ROI (Return on Investment): This is calculated on a per-campaign basis. The formula subtracts the campaign cost from the revenue it generated and then divides that result by the original campaign cost. The result is then multiplied by 100 to get a percentage.
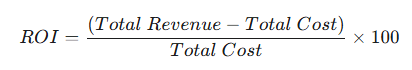
The code implements this with const roi = cost > 0 ? ((revenue - cost) / cost) * 100 : 0; which handles the case where the campaign had no cost.
Essential Marketing Formulas
This document contains a comprehensive list of key marketing metrics and their formulas, categorized for easy reference. You can use these to analyze your campaigns and make data-driven decisions.
Profitability & ROI
This measures the profitability of an investment in relation to its cost.
(Total Revenue - Total Cost) / Total Cost * 100ROAS measures the revenue generated for every dollar spent on advertising.
Total Revenue from Ads / Total Ad SpendLTV is the total revenue a business can reasonably expect from a single customer.
Average Purchase Value * Average Purchase Frequency * Average Customer LifespanCAC is the cost of convincing a potential customer to buy a product or service.
Total Sales and Marketing Costs / Number of New Customers AcquiredAcquisition & Conversions
CPA measures how much it costs to acquire a single conversion.
Total Cost / Total ConversionsThis is the cost you pay for each click on your ad.
Total Ad Spend / Total ClicksCPM is the cost per 1,000 ad impressions.
(Total Ad Spend / Total Impressions) * 1000Conversion rate measures the percentage of users who complete a desired action.
(Number of Conversions / Number of Visitors) * 100Traffic & Engagement
CTR is the percentage of people who click on an ad after seeing it.
(Number of Clicks / Number of Impressions) * 100This is the percentage of visitors who leave after viewing a single page.
(Number of Single-Page Sessions / Number of Total Sessions) * 100This is the average amount of time a user spends on your website.
Email Marketing
This is the percentage of recipients who opened your email.
(Number of Emails Opened / Number of Emails Delivered) * 100The percentage of recipients who clicked on a link in your email.
(Number of Clicks / Number of Emails Delivered) * 100The percentage of recipients who chose to unsubscribe from your mailing list.
(Number of Unsubscribes / Number of Emails Sent) * 100Social Media
This measures how much interaction a piece of content receives from your audience.
(Total Engagements / Total Followers) * 100Reach is the total number of unique people who saw your content. Impressions are the number of times it was displayed.
Impressions = Reach * FrequencyWhy This Tool Will Change Your Workflow
This tool isn’t just a fancy calculator; it’s a game-changer for how you approach campaign analysis.
- Instant Clarity: The dashboard gives you an immediate summary of your overall performance, including total campaigns, total spend, and total conversions. No more digging through multiple tabs to find the numbers you need.
- Smarter Decision-Making: By clearly visualizing each campaign’s CPA and ROI, you can quickly identify your most profitable channels and decide where to allocate more of your budget.
- All-in-One Solution: The tool integrates the data table, summary dashboard, and a visual chart into a single, compact unit, saving you time and effort.
- Simple to Implement: The entire tool is contained within a single block of HTML, CSS, and JavaScript, meaning you can easily embed it on any blog post, landing page, or website with a simple copy and paste.
Final Thoughts
Understanding your campaign data is no longer a task for data scientists and analysts. This tool empowers you to take control of your marketing data and make informed decisions that drive real results. We built it to be a helpful companion for anyone who wants to grow their business and maximize their marketing return.
Try it out on your own site and see how much easier it makes your daily marketing tasks!
<!DOCTYPE html>
<html lang="en">
<head>
<meta charset="UTF-8">
<meta name="viewport" content="width=device-width, initial-scale=1.0">
<title>Simple Campaign Analyst Tool</title>
<script src="https://cdn.jsdelivr.net/npm/chart.js"></script>
<link rel="preconnect" href="https://fonts.googleapis.com">
<link rel="preconnect" href="https://fonts.gstatic.com" crossorigin>
<link href="https://fonts.googleapis.com/css2?family=Inter:wght@400;500;600;700&display=swap" rel="stylesheet">
<!-- Chosen Palette: Soft Beige & Earth Tones -->
<!-- Application Structure Plan: The application is designed as a single-page dashboard with a clear top-down flow. It starts with a simple data input form, followed by a summary dashboard of key metrics, a detailed data table, and a comparative bar chart. This linear structure is intuitive for a marketer, guiding them from data entry to analysis. The dashboard cards, table, and chart all update dynamically, providing immediate feedback and a clear, visual summary. This design prioritizes speed and simplicity for quick, session-based analysis. -->
<!-- Visualization & Content Choices: Report Info: Campaign Performance Data -> Goal: Inform/Compare -> Viz/Presentation Method: Dashboard Metrics, Data Table, and Bar Chart -> Interaction: Form submission to dynamically update all elements -> Justification: The combination of raw numbers (dashboard), a detailed list (table), and a visual comparison (chart) provides a complete picture of campaign health, catering to different modes of analysis. The bar chart is ideal for directly comparing CPA across different campaigns. -> Library/Method: Chart.js, HTML/CSS/JS. -->
<!-- CONFIRMATION: NO SVG graphics used. NO Mermaid JS used. -->
<style>
:root {
--color-primary: #A0522D;
--color-background: #F5F5DC;
--color-text-dark: #4A4A4A;
--color-text-light: #6B7280;
--color-card-bg: #FFFFFF;
--color-border: #D1D5DB;
--color-accent: #E5B28B;
--color-gray-200: #E5E7EB;
--color-gray-50: #F9FAFB;
}
body {
font-family: 'Inter', sans-serif;
background-color: var(--color-background);
color: var(--color-text-dark);
-webkit-font-smoothing: antialiased;
-moz-osx-font-smoothing: grayscale;
}
.container {
max-width: 1280px;
margin: 0 auto;
padding: 3rem 1rem;
}
.header {
text-align: center;
margin-bottom: 3rem;
}
.header-title {
font-size: 2.25rem;
font-weight: 700;
margin-bottom: 0.5rem;
color: var(--color-primary);
}
.header-subtitle {
font-size: 1.125rem;
color: var(--color-text-light);
max-width: 42rem;
margin: 0 auto;
}
.section-container {
background-color: var(--color-card-bg);
padding: 2rem;
border-radius: 0.5rem;
box-shadow: 0 4px 6px -1px rgba(0, 0, 0, 0.1), 0 2px 4px -1px rgba(0, 0, 0, 0.06);
margin-bottom: 3rem;
}
.section-title {
font-size: 1.5rem;
font-weight: 600;
margin-bottom: 1.5rem;
text-align: center;
}
.form-grid {
display: grid;
grid-template-columns: repeat(1, minmax(0, 1fr));
gap: 1.5rem;
align-items: flex-end;
}
@media (min-width: 768px) {
.form-grid {
grid-template-columns: repeat(5, minmax(0, 1fr));
}
}
.form-group {
width: 100%;
}
.form-label {
display: block;
font-size: 0.875rem;
font-weight: 500;
color: var(--color-text-dark);
margin-bottom: 0.25rem;
}
.form-input {
width: 100%;
padding: 0.5rem 0.75rem;
border: 1px solid var(--color-border);
border-radius: 0.375rem;
outline: none;
transition: border-color 0.2s, box-shadow 0.2s;
}
.form-input:focus {
border-color: var(--color-accent);
box-shadow: 0 0 0 2px rgba(160, 82, 45, 0.2);
}
.form-button {
width: 100%;
background-color: var(--color-primary);
color: var(--color-card-bg);
font-weight: 600;
padding: 0.5rem 1rem;
border-radius: 0.375rem;
border: none;
cursor: pointer;
transition: background-color 0.2s, box-shadow 0.2s;
}
.form-button:hover {
background-color: #8D4728;
}
.form-button:focus {
outline: none;
box-shadow: 0 0 0 2px rgba(160, 82, 45, 0.5);
}
.summary-grid {
display: grid;
grid-template-columns: repeat(1, minmax(0, 1fr));
gap: 1.5rem;
}
@media (min-width: 768px) {
.summary-grid {
grid-template-columns: repeat(4, minmax(0, 1fr));
}
}
.card {
background-color: var(--color-card-bg);
border-radius: 0.5rem;
padding: 1.5rem;
box-shadow: 0 4px 6px -1px rgba(0, 0, 0, 0.1), 0 2px 4px -1px rgba(0, 0, 0, 0.06);
text-align: center;
transition: transform 0.3s ease;
}
.card:hover {
transform: translateY(-3px);
}
.card-label {
font-size: 0.875rem;
font-weight: 500;
color: var(--color-text-light);
}
.card-value {
font-size: 1.875rem;
font-weight: 700;
margin-top: 0.25rem;
color: var(--color-primary);
}
.table-container {
background-color: var(--color-card-bg);
border-radius: 0.5rem;
box-shadow: 0 4px 6px -1px rgba(0, 0, 0, 0.1), 0 2px 4px -1px rgba(0, 0, 0, 0.06);
overflow-x: auto;
}
.data-table {
width: 100%;
text-align: left;
white-space: nowrap;
}
.table-header {
background-color: var(--color-gray-200);
color: var(--color-text-dark);
}
.table-header th {
padding: 0.75rem 1.5rem;
font-weight: 500;
}
.table-body tr {
border-bottom: 1px solid var(--color-gray-200);
}
.table-body td {
padding: 1rem 1.5rem;
}
.table-body tr:hover {
background-color: var(--color-gray-50);
}
.chart-container {
position: relative;
width: 100%;
max-width: 900px;
margin-left: auto;
margin-right: auto;
height: 450px;
max-height: 60vh;
}
</style>
</head>
<body class="antialiased">
<main class="container">
<header class="header">
<h1 class="header-title">Campaign Performance Dashboard</h1>
<p class="header-subtitle">
Enter your campaign data below to automatically calculate key metrics and visualize performance. Track your spend, conversions, and ROI in one place.
</p>
</header>
<section class="section-container">
<h2 class="section-title">Add New Campaign Data</h2>
<form id="campaign-form" class="form-grid">
<div class="form-group">
<label for="campaign-name" class="form-label">Campaign Name</label>
<input type="text" id="campaign-name" name="campaign-name" required class="form-input">
</div>
<div class="form-group">
<label for="cost" class="form-label">Total Cost ($)</label>
<input type="number" id="cost" name="cost" required class="form-input">
</div>
<div class="form-group">
<label for="conversions" class="form-label">Conversions</label>
<input type="number" id="conversions" name="conversions" required class="form-input">
</div>
<div class="form-group">
<label for="revenue" class="form-label">Total Revenue ($)</label>
<input type="number" id="revenue" name="revenue" required class="form-input">
</div>
<div class="form-group">
<button type="submit" class="form-button">Add Campaign</button>
</div>
</form>
</section>
<section class="section-container">
<h2 class="section-title">Summary Dashboard</h2>
<div id="dashboard-summary" class="summary-grid">
<div class="card">
<div class="card-label">Total Campaigns</div>
<div id="total-campaigns" class="card-value">0</div>
</div>
<div class="card">
<div class="card-label">Total Spend</div>
<div id="total-spend" class="card-value">$0</div>
</div>
<div class="card">
<div class="card-label">Total Conversions</div>
<div id="total-conversions" class="card-value">0</div>
</div>
<div class="card">
<div class="card-label">Average CPA</div>
<div id="avg-cpa" class="card-value">$0.00</div>
</div>
</div>
</section>
<section class="section-container">
<h2 class="section-title">Campaign Data Table</h2>
<div class="table-container">
<table class="data-table">
<thead>
<tr class="table-header">
<th>Campaign</th>
<th>Cost</th>
<th>Conversions</th>
<th>Revenue</th>
<th>CPA</th>
<th>ROI (%)</th>
</tr>
</thead>
<tbody id="data-table-body" class="table-body">
<!-- Data rows will be added here by JavaScript -->
</tbody>
</table>
</div>
</section>
<section class="section-container">
<h2 class="section-title">Campaign Performance Chart</h2>
<p class="header-subtitle">
This chart visualizes the Cost Per Acquisition (CPA) for each of your campaigns, helping you quickly identify which ones are most efficient.
</p>
<div class="chart-container">
<canvas id="performanceChart"></canvas>
</div>
</section>
</main>
<script>
document.addEventListener('DOMContentLoaded', () => {
const form = document.getElementById('campaign-form');
const dataTableBody = document.getElementById('data-table-body');
const totalCampaignsEl = document.getElementById('total-campaigns');
const totalSpendEl = document.getElementById('total-spend');
const totalConversionsEl = document.getElementById('total-conversions');
const avgCpaEl = document.getElementById('avg-cpa');
const chartCanvas = document.getElementById('performanceChart');
let campaigns = [];
let performanceChart;
const calculateMetrics = (cost, conversions, revenue) => {
const cpa = conversions > 0 ? (cost / conversions) : 0;
const roi = cost > 0 ? ((revenue - cost) / cost) * 100 : 0;
return { cpa: cpa.toFixed(2), roi: roi.toFixed(2) };
};
const updateDashboard = () => {
const totalSpend = campaigns.reduce((sum, c) => sum + c.cost, 0);
const totalConversions = campaigns.reduce((sum, c) => sum + c.conversions, 0);
const avgCpa = totalConversions > 0 ? (totalSpend / totalConversions) : 0;
totalCampaignsEl.textContent = campaigns.length;
totalSpendEl.textContent = `$${totalSpend.toFixed(2)}`;
totalConversionsEl.textContent = totalConversions;
avgCpaEl.textContent = `$${avgCpa.toFixed(2)}`;
dataTableBody.innerHTML = '';
campaigns.forEach(campaign => {
const row = document.createElement('tr');
row.className = 'table-row';
row.innerHTML = `
<td>${campaign.name}</td>
<td>$${campaign.cost}</td>
<td>${campaign.conversions}</td>
<td>$${campaign.revenue}</td>
<td>$${campaign.cpa}</td>
<td>${campaign.roi}%</td>
`;
dataTableBody.appendChild(row);
});
};
const updateChart = () => {
if (performanceChart) {
performanceChart.destroy();
}
const chartData = {
labels: campaigns.map(c => c.name),
datasets: [{
label: 'Cost Per Acquisition ($)',
data: campaigns.map(c => c.cpa),
backgroundColor: 'rgba(160, 82, 45, 0.6)',
borderColor: 'rgba(160, 82, 45, 1)',
borderWidth: 1
}]
};
performanceChart = new Chart(chartCanvas, {
type: 'bar',
data: chartData,
options: {
responsive: true,
maintainAspectRatio: false,
scales: {
y: {
beginAtZero: true,
title: {
display: true,
text: 'CPA ($)'
}
},
x: {
title: {
display: true,
text: 'Campaign'
}
}
},
plugins: {
legend: {
display: false
}
}
}
});
};
form.addEventListener('submit', (e) => {
e.preventDefault();
const name = document.getElementById('campaign-name').value;
const cost = parseFloat(document.getElementById('cost').value);
const conversions = parseInt(document.getElementById('conversions').value);
const revenue = parseFloat(document.getElementById('revenue').value);
if (!name || isNaN(cost) || isNaN(conversions) || isNaN(revenue)) {
return;
}
const metrics = calculateMetrics(cost, conversions, revenue);
const newCampaign = { name, cost, conversions, revenue, cpa: metrics.cpa, roi: metrics.roi };
campaigns.push(newCampaign);
updateDashboard();
updateChart();
form.reset();
});
updateDashboard();
updateChart();
});
</script>
</body>
</html>
Read this blog post
Google Analytics Returning Users: A Beginner Guide
Anup Ain
Hey, my name is Anup Ain. I am a blogger and a digital marketing intern. I enjoy sharing my knowledge and experiences with others.